Ultimate Guide to Warehouse KPIs
Warehouse KPIs are metrics that measure how well your warehouse is performing. They help you track efficiency, reduce costs, and improve customer satisfaction. Key areas include receiving, storage, picking, shipping, and labor productivity. For example:
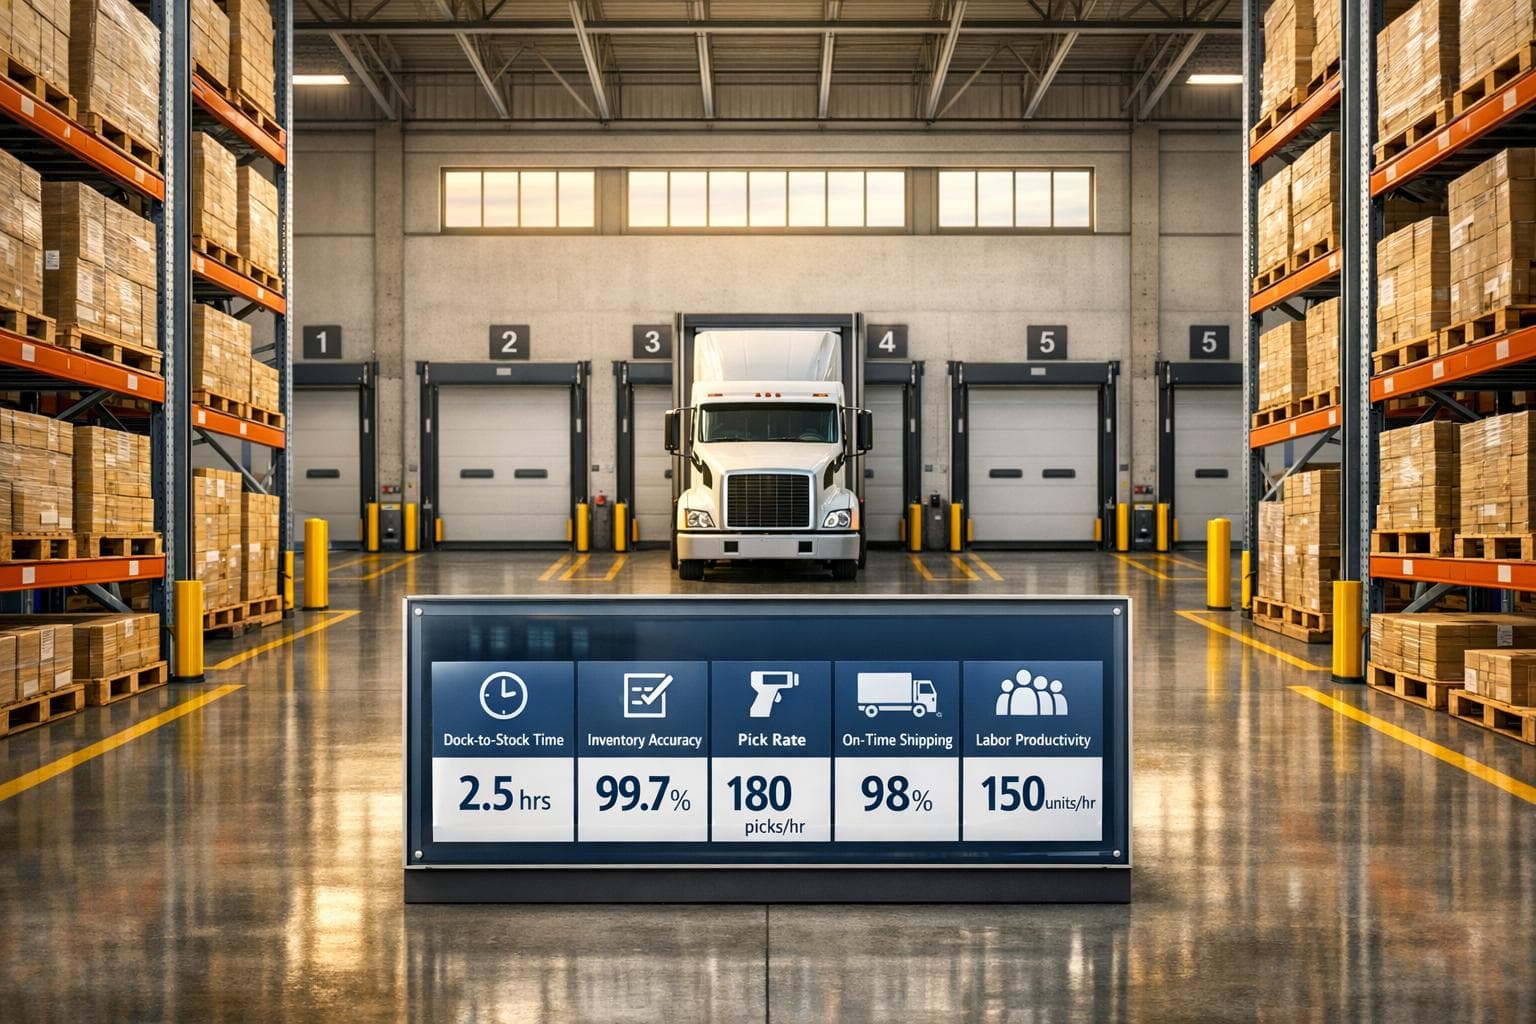
- Dock-to-Stock Time: Measures how quickly goods are ready for use (2–4 hours is ideal).
- Inventory Accuracy: Tracks how closely records match physical stock (99.9% is the goal).
- Picking Accuracy: Ensures orders are picked correctly (aim for 99.9%).
- On-Time Delivery: Measures delivery reliability (95–98% is standard).
- Labor Productivity: Tracks units processed per hour (150–220 UPH for picking).
Using tools like Warehouse Management Systems (WMS) and real-time dashboards makes tracking and improving these KPIs easier. Start by setting clear, measurable goals and reviewing performance regularly. Data-driven warehouses are more profitable and better at meeting customer expectations.
23 Key Warehouse KPIs for Operational Efficiency
sbb-itb-c0b8770
Main Categories of Warehouse KPIs
Breaking down warehouse KPIs into distinct categories helps managers identify inefficiencies at specific stages of operations. Warehousing is a chain of interconnected processes, and a bottleneck in one area can disrupt the entire system. By categorizing KPIs, you can move beyond guesswork and clearly see where time, space, or money is being wasted. These categories cover everything from receiving inventory to delivering it to the customer.
Receiving and Putaway KPIs
These KPIs focus on the inbound process, measuring how quickly and accurately your team handles incoming shipments and gets inventory ready for use. Key metrics include dock-to-stock time, receiving efficiency (volume processed per labor hour), and putaway accuracy. Inefficiencies here can lead to dock congestion and "phantom" stockouts - when items are in the warehouse but not yet available in the system. Top-performing e-commerce operations aim for a dock-to-stock time of 2 to 4 hours.
Storage and Inventory KPIs
This category tracks how well you're using your warehouse space and managing inventory. Metrics include capacity utilization (how much of your available space is actively used), inventory turnover (how quickly stock moves through the warehouse), and carrying costs. Ideally, capacity utilization should fall between 85% and 90%; exceeding this can cause congestion and reduce efficiency. Inventory accuracy is another critical metric. Facilities using advanced systems achieve accuracy rates between 97% and 99.9%, while those without such tools may see rates as low as 60% to 85%.
Picking and Fulfillment KPIs
These metrics measure the efficiency and accuracy of retrieving items for orders. Important indicators include picking accuracy rate and picks per hour. Since picking can account for up to 55% of warehouse labor costs, optimizing this process is crucial. According to OPEX:
"Picking is one of the most complex and time-consuming warehouse operations, directly affecting fulfillment speed and customer satisfaction."
For single-line e-commerce orders, picking rates typically range from 150 to 220 units per hour. In contrast, B2B operations handling bulky items often see rates between 20 and 40 units per hour.
Shipping and Distribution KPIs
This category evaluates the outbound process, focusing on metrics like on-time shipping rates, perfect order rates (orders delivered complete, undamaged, and with correct documentation), and carrier cutoff compliance. Leading warehouses achieve perfect order rates of 97% to 98%, while average facilities hover between 85% and 90%. These KPIs have a direct impact on customer satisfaction and marketplace ratings.
Labor and Safety KPIs
Labor and safety metrics cut across all warehouse operations, tracking workforce productivity and risk management. Key measures include units per hour (UPH), cost per order, and Total Recordable Incident Rate (TRIR). With labor costs making up 50% to 70% of total warehouse expenses, monitoring these KPIs is essential for controlling costs. However, balancing productivity goals with safety is critical, as high throughput targets can increase the risk of accidents.
Top Warehouse KPIs and How to Measure Them

Top 5 Warehouse KPIs: Formulas and Industry Benchmarks
Building on the earlier categories, the following KPIs provide clear ways to assess and improve key warehouse operations. Each one includes measurement methods, benchmarks, and actionable steps to enhance performance.
Dock-to-Stock Time
This KPI measures the time it takes for goods to move from arrival at the dock to being ready for picking in the warehouse system. To calculate, subtract the arrival timestamp from the time the goods are marked as available in your system. The goal? A quick 2–4 hours.
To speed up this process, consider using Advanced Shipping Notifications (ASNs) to plan storage space before the goods even arrive. RF or RFID scanning can help with fast verification, while a Warehouse Management System (WMS) equipped with directed putaway logic can assign storage locations based on item size and turnover rates.
Next, let’s look at Inventory Accuracy to keep stock records reliable.
Inventory Accuracy
This metric evaluates how closely your physical stock matches the records in your WMS. The formula is simple: (System Count / Physical Count) × 100. Top-tier systems can achieve an impressive 99.9% accuracy rate. Instead of annual physical counts, switch to ABC-driven cycle counting, where high-demand items are checked more often.
To tighten accuracy further, implement scan-to-verify protocols for every inventory movement. Configure your WMS to lock a bin location if discrepancies arise, triggering an immediate cycle count to resolve the issue.
Once inventory is in check, focus on Picking Accuracy Rate to reduce errors.
Picking Accuracy Rate
This KPI measures the percentage of items picked correctly without errors in SKU, quantity, or variant. The formula: (Correct Picks / Total Picks) × 100. Industry leaders aim for a 99.9% or higher accuracy rate.
To achieve this, use tech-driven solutions like pick-to-light systems, voice-directed picking, or wearable scanners that guide workers to the correct location and verify items. Introduce weight verification at packing stations to catch errors and use photo documentation to minimize damage claims. Additionally, reorganize high-demand SKUs into "golden zones" (waist-level shelves near shipping docks) to cut down on travel and reduce fatigue-related mistakes.
After ensuring accurate picking, monitor On-Time Delivery Rate to maintain customer satisfaction.
On-Time Delivery Rate
This metric tracks how often orders are delivered on or before the promised date. Calculate it as (On-time Orders / Total Orders) × 100. World-class operations typically hit rates between 95% and 98%.
To improve this, use route optimization software to plan efficient delivery paths and create carrier performance scorecards with clear Service Level Agreements (SLAs). Align your picking schedules with carrier cutoff times to ensure orders make the final daily pickup. Diversify your carrier options to include both national and regional providers to reduce delays.
Finally, assess Labor Productivity to ensure your workforce is operating efficiently.
Labor Productivity (Units Per Hour)
This KPI measures how many units workers process per hour. The formula is straightforward: Total Units / Total Labor Hours. Typical picking rates fall between 150 and 220 units per hour, with best-in-class labor costs often under $1.50 per unit.
Boost productivity by using a Labor Management System (LMS) to establish standards based on task complexity and reward employees for exceeding targets. Optimize your warehouse layout to reduce "dead travel" - non-productive walking that can consume over 50% of a worker’s time. Task interleaving, where workers are assigned a nearby task after completing one, can also cut down on wasted time.
These KPIs serve as a powerful toolkit for monitoring and improving warehouse operations.
| KPI | Formula | Leading Benchmark |
|---|---|---|
| Dock-to-Stock Time | Time from arrival to ready-for-pick | 2–4 hours |
| Inventory Accuracy | (System Count / Physical Count) × 100 | 99.9% |
| Picking Accuracy | (Correct Picks / Total Picks) × 100 | 99.9% or above |
| On-Time Delivery | (On-time Orders / Total Orders) × 100 | 95–98% |
| Labor Productivity | Total Units / Total Labor Hours | 150–220 UPH |
How to Implement and Monitor Warehouse KPIs
Turning raw data into meaningful insights is the backbone of successfully implementing warehouse KPIs. Companies that embrace data-driven strategies can see profitability gains of up to 25% compared to their competitors. However, the real challenge lies in weaving these metrics seamlessly into daily operations.
Setting Realistic KPI Goals
Begin by evaluating your current measurement tools and identifying any gaps in your systems. Use historical data from your Warehouse Management System (WMS) and Labor Management System (LMS) to establish clear baselines.
Every goal should follow the SMART framework: Specific, Measurable, Achievable, Relevant, and Time-bound. For instance, instead of vaguely aiming to "improve picking accuracy", set a precise target like achieving a 98% accuracy rate within six months by implementing scan-to-verify protocols. Assign accountability by designating specific individuals or teams to oversee each metric.
Focus on KPIs that align with your broader objectives, whether that's cutting costs, speeding up order fulfillment, or improving customer satisfaction. To ensure consistency, create a "KPI Dictionary" that defines formulas for key metrics across all teams and locations. For example, standardize Receiving Accuracy as (Actual ÷ Expected × 100) so calculations remain uniform.
Finally, use automated tools to monitor these goals in real time.
Using Warehouse Management Systems (WMS)
Modern WMS platforms simplify KPI tracking by integrating with tools like barcode scanners, RFID, and IoT sensors. These systems capture real-time data and timestamps for every movement in the warehouse, eliminating manual tracking and providing instant visibility into performance. Configure dashboards with color-coded visuals to highlight deviations from targets and set up automated alerts for when metrics fall outside acceptable ranges. This lets managers tackle issues before they escalate.
Assigning clear ownership of metrics ensures timely adjustments to the system. Advanced setups, like Digital Twins, take this a step further. These virtual replicas of your warehouse allow you to simulate layout or process changes and predict their impact on KPIs before making physical adjustments.
| Technology Component | Role in KPI Tracking |
|---|---|
| WMS | Tracks timestamps for order flows, accuracy, and dock-to-stock time |
| LMS | Measures individual performance against engineered labor standards |
| IoT Sensors | Monitors equipment health, temperature, and location automatically |
| Digital Twins | Simulates changes to predict their impact on KPIs |
With these tools, you’re equipped to monitor KPIs continuously and make data-driven improvements.
Continuous Improvement Through KPI Analysis
Set review schedules that match the frequency of each metric. For example, track high-frequency indicators like picks per hour during daily shift meetings, while reviewing broader metrics like inventory turnover during monthly planning sessions. This approach avoids information overload while ensuring teams stay focused on actionable improvements.
"The most powerful analytics are worthless if they aren't accessible to decision-makers at all levels of the organization."
– OPEX
Make data accessible by displaying real-time dashboards in shared areas. Companies that actively use warehouse metrics are 23 times more likely to gain customers and 19 times more likely to be profitable. Involving warehouse staff in choosing metrics and improvement strategies fosters engagement and helps set achievable goals.
Use KPI analysis to spot trends and uncover bottlenecks. For example, if dock-to-stock time increases, dig deeper to find the root cause - whether it’s supplier delays, staging congestion, or staffing issues. Address these problems with targeted solutions like re-slotting fast-moving items, adjusting labor schedules, or providing specialized training. Organizations that rely on data tools for decision-making are 58% more likely to hit revenue targets and 162% more likely to exceed them.
How CR Express Uses Warehouse KPIs
At CR Express, warehouse KPIs are at the core of our operations, ensuring efficient service across our 280,000 sq ft facility. By closely monitoring key metrics, we meet the tight timelines demanded by time-sensitive cargo while maintaining the precision necessary for industries like pharmaceuticals and automotive parts.
Space Utilization Tracking in GDP-Compliant Facilities
Managing space effectively is critical when dealing with temperature-sensitive pharmaceuticals and high-value goods. Our Warehouse Management System offers real-time inventory visibility through a secure online portal, allowing both our team and clients to monitor stock levels, track expiration dates, and identify underused areas early on.
The facility is divided into climate-controlled zones and dedicated high-value storage areas, all monitored to maintain an ideal capacity utilization of 85–90%. This balance prevents overcrowding and maximizes available space. With over 500 container storage spaces and more than 10 acres of secured yard space, we use these insights to decide when to shift inventory between floor storage and racking systems or to expedite throughput for fast-moving SKUs. This structured approach ensures compliance with GDP standards while optimizing costs for our partners.
From here, we turn our focus to enhancing dock-to-stock efficiency for seamless operations.
Improving Dock-to-Stock Time in Transloading Operations
Speed and dependability are at the heart of our transloading services. Every hour a shipment waits after arriving from railyards or airport terminals delays inventory availability. That’s why we track dock-to-stock time - the interval between receiving, inspecting, and storing goods - as a critical metric.
Our operations align with the industry benchmark of 2–4 hours, supported by a 7-day operational model that eliminates weekend delays. Whether a container arrives on a weekday afternoon or early Sunday morning, we process shipments continuously, sorting them by PO, SKU, or part number. This consistent service, combined with our Container Freight Station operations, ensures smooth transitions between transport modes. For urgent air freight arriving at O’Hare, this efficiency supports same-day recovery when immediate turnaround is necessary.
Alongside fast processing, our strategic location and advanced technology ensure exceptional delivery performance.
Ensuring On-Time Delivery with Chicago Location
On-time delivery is a key measure of success, with world-class operations aiming for 98–99% on-time rates. Our location, less than 5 miles from Chicago O’Hare International Airport and close to major Chicagoland railyards, gives us a logistical advantage in meeting these high standards.
With real-time GPS tracking, we monitor every shipment from the moment it leaves the warehouse to its final destination. This visibility allows us to spot and address potential delays early, offering same-day recovery solutions when needed. For local deliveries within a 60-mile radius of O’Hare, our same-day and next-day services enable clients to maintain just-in-time delivery strategies without compromising reliability. By combining our location, technology, and disciplined operations, we consistently achieve the high on-time delivery rates required by time-sensitive industries.
Conclusion
Warehouse KPIs play a critical role in driving success in today’s logistics landscape. According to research from McKinsey Global Institute, data-driven organizations are 23 times more likely to acquire customers, six times more likely to retain them, and 19 times more likely to achieve profitability. The key difference between companies leading the industry and those falling behind lies in their ability to turn subjective insights into measurable, actionable data.
The first step is assessing your current performance and setting SMART goals that align with your broader business objectives. Data-driven companies are 58% more likely to meet revenue targets and 162% more likely to exceed them. Instead of tracking every possible metric, focus on those with the greatest impact, such as inventory accuracy, dock-to-stock time, and on-time delivery. Given that picking operations can account for up to 55% of total warehouse labor costs, even modest improvements in efficiency and accuracy can lead to significant cost savings.
At CR Express, our 280,000 sq ft facility is designed with these principles in mind. Located less than 5 miles from Chicago O’Hare, our GDP-compliant operations leverage real-time tracking systems to maintain key performance benchmarks: 85–90% space utilization, 2–4 hour dock-to-stock cycles, and 98–99% on-time delivery rates. Whether you’re managing pharmaceutical cold chain logistics, automotive parts, or time-sensitive air freight, our integrated technology ensures the visibility you need to make informed decisions.
The foundation of operational excellence lies in consistent measurement and improvement. By actively monitoring and refining your KPIs, you can optimize resources, minimize waste, and strengthen your brand’s reputation. As we look toward 2026 and beyond, the warehouses that succeed will be those that embrace data-driven strategies as a cornerstone of their operations.
FAQs
Which warehouse KPIs should I track first?
To get a clear picture of how well your operations are running, focus on tracking KPIs that reveal efficiency and accuracy. Start with metrics like order accuracy rate, inventory turnover, on-time delivery, and warehouse capacity utilization. These numbers can pinpoint issues in areas like order fulfillment, inventory flow, and how effectively you're using storage space.
Beyond that, keep an eye on labor productivity, picking accuracy, and the perfect order rate. These metrics shed light on how well your team is performing and whether your processes are running smoothly. Together, these insights form a solid base for smarter decisions and ongoing improvements.
How often should I review each KPI?
The best frequency for reviewing KPIs depends on their type and your warehouse's specific requirements. Operational KPIs, such as order accuracy or labor productivity, typically need to be reviewed daily or weekly to keep a close eye on real-time performance. On the other hand, strategic KPIs - like inventory turnover or space utilization - are more suited for monthly or quarterly reviews, as they focus on broader trends and long-term goals. Balancing these frequent operational reviews with periodic strategic evaluations helps maintain both short-term efficiency and long-term success.
What’s the fastest way to improve inventory accuracy?
The fastest way to improve inventory accuracy is by implementing barcode scanning technology alongside a modern warehouse management system (WMS). These tools allow for real-time tracking, cutting down on manual errors and inconsistencies. Aligning warehouse KPIs with workflows - such as receiving and picking - helps spot problems early on. Automating data collection and keeping an eye on key metrics ensures accurate data capture, which translates to instant gains in both accuracy and efficiency.